Automate Log Parser to Find Your Data Faster
Microsoft’s Log Parser is a really powerful tool for searching log files. With just a few simple SQL commands you can pull more data than you ever imagined out of your logs. It can be used to read web site log files, csv files, and even Windows event logs. Log Parser isn’t intended to compete with stats products such as Webtrends Log Analyzer or SmarterStats by Smartertools.com which I feel is the best on the market.
I primarily use Log Parser for troubleshooting problems with a site such as identifying http errors or long running page requests. When I look into an issue I also like to get a snapshot for the day’s traffic such as the top IP addresses making requests and the top bots hitting the site. This is all available from Log Parser once you know the right queries to run.
As one can imagine when a site is having problem you want to know as much information as quickly as possible. Manually running Log Parser queries on a site’s log files is not easy when you have an urgent problem resolve. My biggest challenge with using Log Parser is remembering the different queries I want and getting the syntax correct. Solving this challenge is easier than one might think and involves just creating the scripts ahead of time that you need.
I just create a batch file called logparse.bat and use the %1 parameter for the name of the log file that I want to analyze and then I redirect the output of the query to a text file:

Here are the queries I am using:
"c:\temp\logparser.exe" -i:iisw3c "select top 25 count(*), cs-uri-stem from %1 group by cs-uri-stem order by count(*) desc" -rtp:-1 >top25req.txt

"c:\temp\logparser.exe" "select Top 10 count(*), c-ip from %1  group by c-ip order by Count(*) DESC" -o:csv >topIP.txt

"c:\temp\logparser.exe" "select Top 10 count(*), c-ip, cs(User-Agent) from %1 group by c-ip, cs(User-Agent) order by Count(*) DESC" -o:csv >topBot.txt
Running this from the command line is simple. You just specify path to the log file as a parameter.
c:\temp\logparse c:\wwwlogs\w3svc1\u_ex120921.log
Running this will create 3 files showing the top 25 requests, top bots hitting the site and the top IP addresses making requests. This is valuable information but we really need more information to know what’s going on with our site. Here’s a more advanced query using a SQL file. Just as before we’re going to use parameters and then call it from our logparse.bat file. This query is stored in a separate file called topstatuscodes.sql
SELECT 	STRCAT(TO_STRING(sc-status), STRCAT('.', TO_STRING(sc-substatus)))
 AS Status,
	COUNT(*) AS Total
FROM %source% to %destination%
GROUP BY Status
ORDER BY Total DESC
Here is how we call this external file from our logparse.bat file:
"c:\temp\logparser.exe" file:TopStatusCodes.sql?source=%1+destination=TopStatusCodes.txt -o:NAT
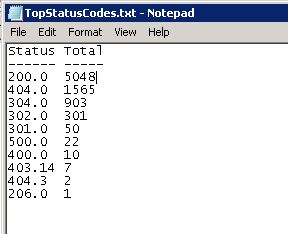
Here is what the output of this particular query looks like:

Immediately we can see that our site had 1,564 HTTP 404 errors as well as 22 HTTP 500 errors. That many 404 errors indicates a problem with the site’s design and could impact performance. So let’s create another query and output the results to a file to see where the 404 errors are coming from:
SELECT
TOP 10
STRCAT(EXTRACT_PATH(cs-uri-stem),'/') AS RequestPath, sc-status,
EXTRACT_FILENAME(cs-uri-stem) AS RequestedFile,
COUNT(*) AS TotalHits,
MAX(time-taken) AS MaxTime,
AVG(time-taken) AS AvgTime,
AVG(sc-bytes) AS AvgBytesSent
FROM %source% TO %destination%
where sc-status=404
GROUP BY cs-uri-stem, sc-status
ORDER BY MaxTime, TotalHits DESC
Here is how we run this query from our logparse.bat file:
"c:\temp\logparser.exe" file:Top10-404-WebRequests.sql?source=%1+destination=Top10-404-WebRequests.txt -o:NAT
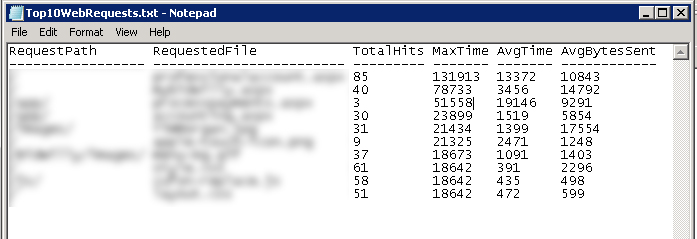
The output of this query provides all the information we need to track down the issue including request path and the requested file.

Let’s look at one more of my favorite Log Parser queries: the top 10 longest running page requests. This will show us the 10 slowest pages on the site. This can be invaluable information when diagnosing a problem. Here is the query which I save in a file called top10webrequests.sql:
SELECT
TOP 10
STRCAT(EXTRACT_PATH(cs-uri-stem),'/') AS RequestPath,
EXTRACT_FILENAME(cs-uri-stem) AS RequestedFile,
COUNT(*) AS TotalHits,
MAX(time-taken) AS MaxTime,
AVG(time-taken) AS AvgTime,
AVG(sc-bytes) AS AvgBytesSent
FROM %source% TO %destination%
GROUP BY cs-uri-stem
ORDER BY MaxTime, TotalHits DESC
Here is how we call it from our logparse.bat file. It will redirect the output to a file called top10webrequests.txt:
"c:\temp\logparser.exe" file:Top10WebRequests.sql?source=%1+destination=Top10WebRequests.txt -o:NAT

The numbers shown in this report seem incredibly high at first glance but do not be alarmed. The IIS log format uses microseconds so you have to divide each of the numbers by 1000. So by doing that we can see that one request took well over 2 minutes to complete and another averages 19 seconds to complete. These are red flags that need immediate investigation.
So in summary I have shown 6 great log parser queries you can you run from a batch file to automate your web log analysis. Anytime someone reports a performance problem you can provide valuable data within seconds. But this is really just scratching the surface. You could add 5-10 more queries to the batch file to get even more data depending on your needs.
Please note: if you use the examples I’ve provided be sure to change the paths to where your logparser.exe is located.