How to Troubleshoot Live Smooth Streaming Issues? – Part 4 (Performance Counters)
3. Performance Counters
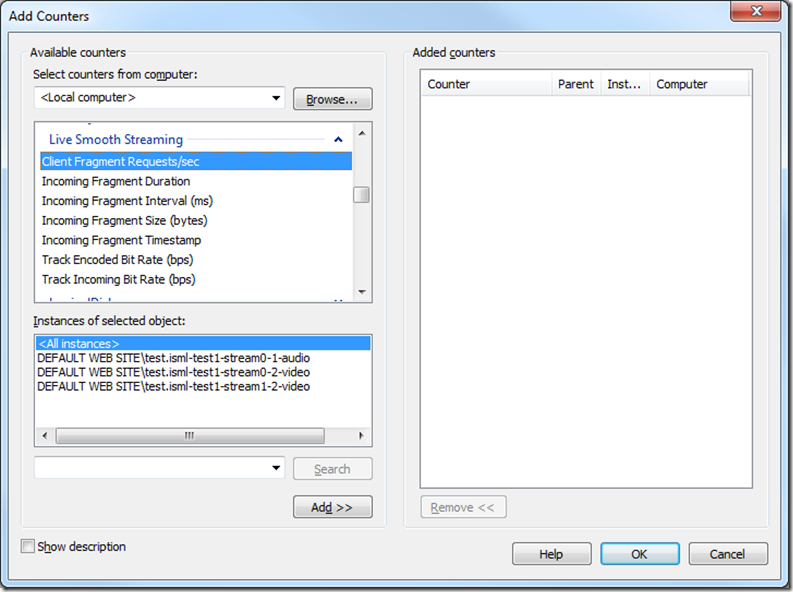
IIS Media Services also output some performance counters for tracking live smooth streaming status. When the publishing point is running, you should be able to see performance counters under “Live Smooth Streaming” category with multiple instances each of which corresponds to a track. The naming convention of the instance name is: {Publishing Point virtual path and name}-{Stream ID}-{Track ID}-{Track Type}. The description of each counters is available in the Performance Monitor UI once you click the “Show description” checkbox. In general, the information you get here is very similar to what’s exposed through the publishing point detailed view on the UI. The advantage of using performance counter is that you can easily plot the chart or log the data using Performance Monitor tool.
There are some other system performance counters that are also very useful in monitoring live smooth streaming server:
“Web Service”->”Get Request/sec” – This is a generic IIS counter for tracking GET request rate. Since that smooth streaming clients use GET request for manifest and fragment, you can use this counter to gauge the rough client load on the server. But keep in mind that if your web server is also serving other types of contents (web page, image, asp.net, etc.), those requests would also be included in this counter.
“Physical Disk”->”%Disk Time” and others – Disk I/O is often one of the bottlenecks for a live smooth streaming server because it’s constantly doing a lot of disk writes (for archiving content) and disk reads (for serving client requests). Closely monitoring this set of counters would be important.
“Memory”->”Available MBytes” and “Cache Bytes” – To minimize the physical disk reads and writes, live smooth streaming server heavily utilizes Windows’s file cache. If you know how Windows file cache works, this set of counters would be useful to determine the state of the server in terms of memory usage.
“Network Interface”->”Packets Received Errors” and others – This set of counters report the status of the network card. If there’s any hardware/firmware issues causing data corruption or connection loss, these counters might be able to help.
“Process”->”Private Bytes”, “Handle Count”, “Working Set”, etc.->”w3wp” – Standard way to monitor the performance of a particular process. In this case, w3wp.exe is the one for IIS’s worker process. Make sure you choose the right one if you have multiple worker processes running.
Given that Live smooth streaming server runs as part of IIS on Windows Server platform, there are many other system performance counters that you might find useful when monitoring live smooth streaming server. You could also check the performance tuning guideline for Windows Server 2008 and Windows Server 2008 R2 for instructions on tuning storage, network and web server workloads.
